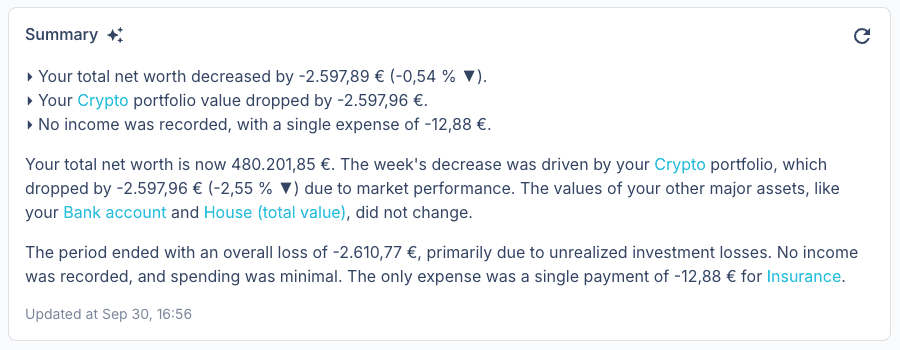
Introducing monthly summary emails
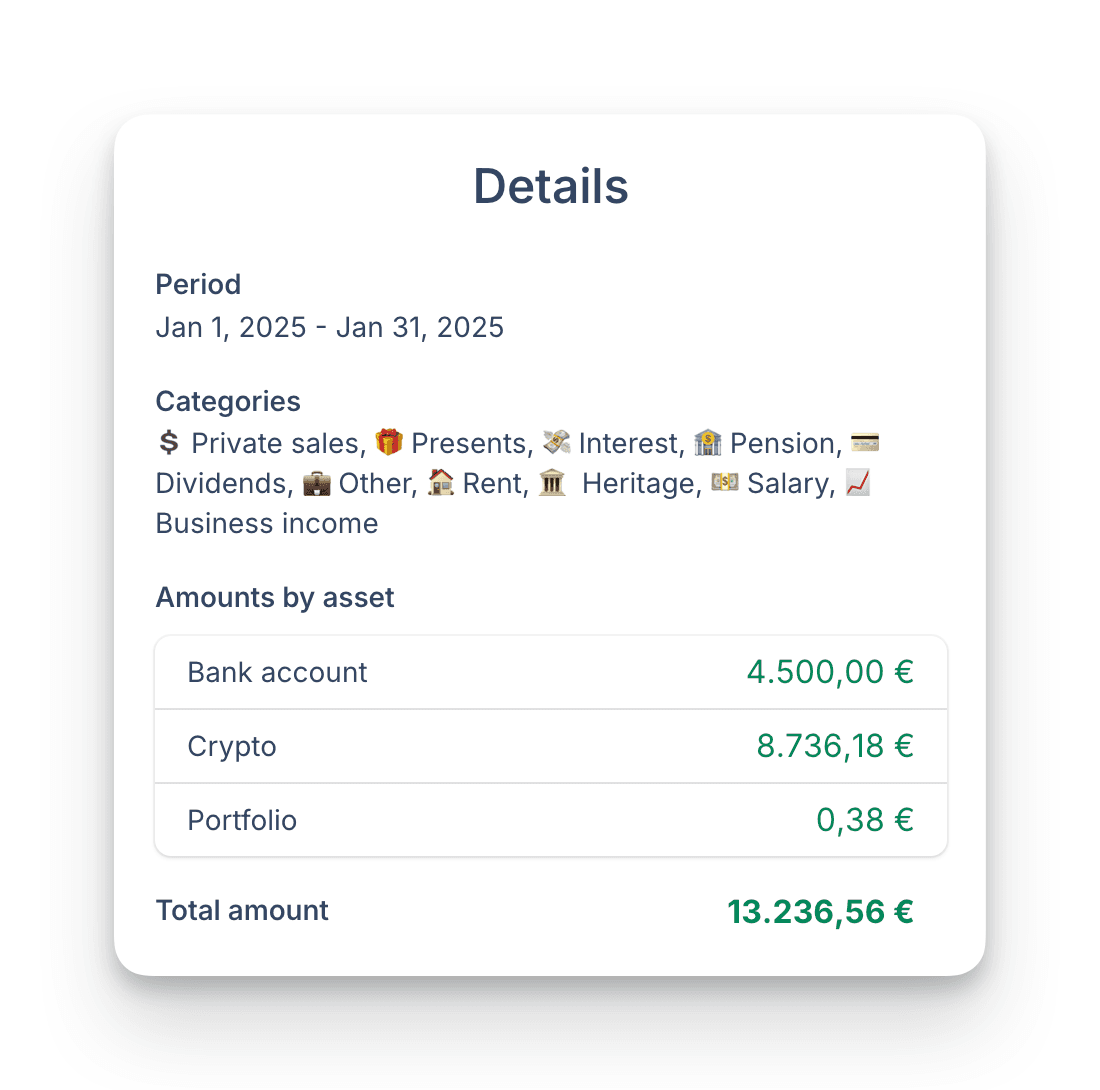
We’ve added a monthly summary email alongside the weekly one. It’s tailored to the monthly reporting cycle, bringing a clearer overview of income, spending, savings, and month‑over‑month changes. Monthly summaries are especially helpful for items like salary or recurring bills that don’t always align well with a weekly view.