
Effective financial decision-making requires having the right information available. While tracking your finances is essential, analyzing your data through meaningful visualizations and reports helps you optimize your financial strategy and build wealth over time. Today, we're introducing our redesigned reports section in Walletguide, offering improved insights into your financial data.
The new reports build upon the foundation of organized personal finances, transforming well-structured data into actionable insights.
A new approach to financial reporting
The updated reports section enhances our previous analytics capabilities. We've rethought how financial data should be presented to give you clearer insights into your wealth, spending patterns, and recurring transactions. This update offers visualizations that make financial data more understandable.
The new reports are organized into three tabs, each focusing on a specific aspect of your financial life:
- Net worth: Track your overall financial position and wealth growth over time
- Income and expenses: Analyze your cash flow patterns in detail
- Recurring: Identify and manage your recurring transactions (income and expenses)

Central filters for quick segmentation
At the top of the new reports section, you'll find our central date period and asset filters. These allow you to select the specific date period you're interested in and focus on the assets of your choice. For the income & expenses tab, we've added a category filter that allows you to filter even more precisely. This flexibility is valuable when analyzing different aspects of your financial strategy.
Net worth metrics
The net worth tab provides a view of your overall financial position and wealth accumulation.
Net worth status quo and development over time
We display your total net worth next to your emergency fund, which is the portion of your net worth that you can access quickly. Below that, we show a line chart that tracks your net worth development over time.

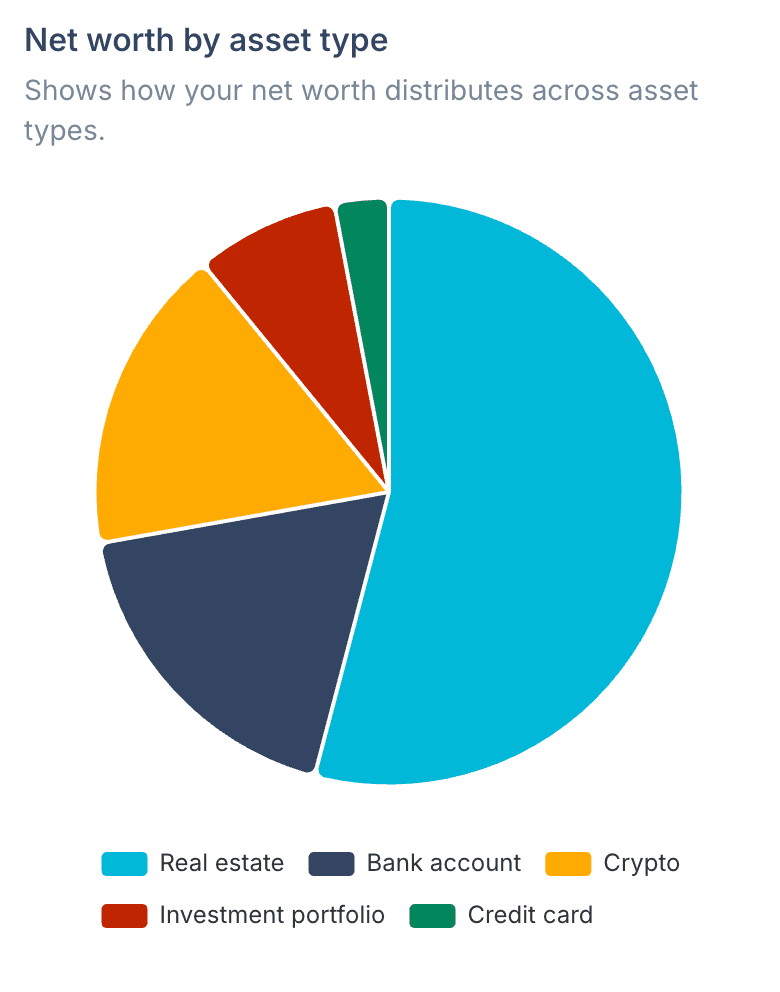
Net worth by asset type
See how your wealth is distributed across different asset classes such as cash, investments, real estate, and other assets. This helps ensure your portfolio maintains your desired diversification.
Net worth by asset group
You can use asset groups to structure your assets in the most effective way. With this analysis, you can examine the asset group hierarchy in one view and see how your net worth is distributed across these groups and assets.

Net worth change by asset
See how the net worth in each asset changed during a specific period. You can also switch this analysis to view changes by asset type, group, or liquidity. This insight helps you identify which assets are contributing most to your overall growth.

Net worth by access liquidity
This chart shows the breakdown of your net worth into liquid, semi-fixed, and fixed assets over time. Liquidity defines how easily and quickly you can access the funds within an asset. For example, real estate assets are typically fixed, while bank accounts are liquid. Understanding this balance is essential for both short-term financial security and long-term planning.

Net worth change heatmap
In this heatmap, you can see the change in net worth across all years and months. This provides a quick overview of the historical development of your personal finances over time.

Transfers between assets
This graph shows how funds were transferred between assets during a specific period. It displays how your asset allocation has changed in an intuitive way.

Income and expenses metrics
The income and expenses tab helps you understand your cash flow patterns, a fundamental aspect of financial health.
Income vs expenses overview
Get a quick view of your total income and expenses for the selected period, along with your gains, losses, and resulting profit. This overview helps you understand your current savings rate.

Income vs expenses over time
This chart shows your income and expenses side by side for each period, allowing you to see trends and identify months with unusual patterns. Tracking these patterns helps you make adjustments to optimize your finances.

Flow of income and expenses
The Sankey diagram visualizes how your income flows to different expense categories, making it easy to see where your money is coming from and where it is going.

Expenses by category
Analyze your spending by category with this interactive chart. Even with complex category hierarchies, this visualization reveals clear patterns and makes it easy to understand how you spend your money. Identifying areas to optimize can free up resources for your financial goals.

Expenses heatmap
The heatmap shows patterns across all months and years, helping you identify seasonal trends or unusual behavior. This chart works with various metrics including income, active income, passive income, expenses, fixed expenses, variable expenses, gains/losses, profit, and plain profit, providing insights for long-term financial planning.

Recurring transactions
The recurring tab helps you track regular income and expenses. View all your recurring transactions in one place to better manage subscriptions and regular financial commitments. Optimizing these recurring expenses can significantly impact your long-term financial health.

For users who prefer a simplified approach to tracking, you can focus on tracking net worth with total values rather than detailed transaction analysis.
Designed for users with advanced needs
As entrepreneurs ourselves, we understand that financial clarity is important for both personal and business success. The new reports section is designed with more complex scenarios in mind, providing detailed analytics that help you make informed decisions about your finances and your overall wealth.
Whether you're planning your next business venture, optimizing your investment strategy, or seeking better control over your personal finances, these reports provide insights to help you move forward with confidence.
For entrepreneurs comparing Walletguide to other financial tools, see how Walletguide compares to specialized personal finance tools and why a holistic approach often proves most effective.
Ongoing improvements
This update is an important step in our mission to provide a useful personal finance and wealth tracking tool. We plan to continue refining and expanding our reporting capabilities based on your feedback.
We invite you to explore the new reports section and discover insights in your financial data. As always, we welcome your feedback on how we can make Walletguide more valuable for your financial journey.
By combining effective visualizations with meaningful metrics, our new reports section transforms financial data into actionable insights. We believe this is a useful advancement for Walletguide, and we hope it helps you achieve your financial goals and build lasting wealth.